Solar Plant Data Analysis
Gözde analyses solar plant performance. She turned work that needed expensive licensed software into her own Python pipeline.
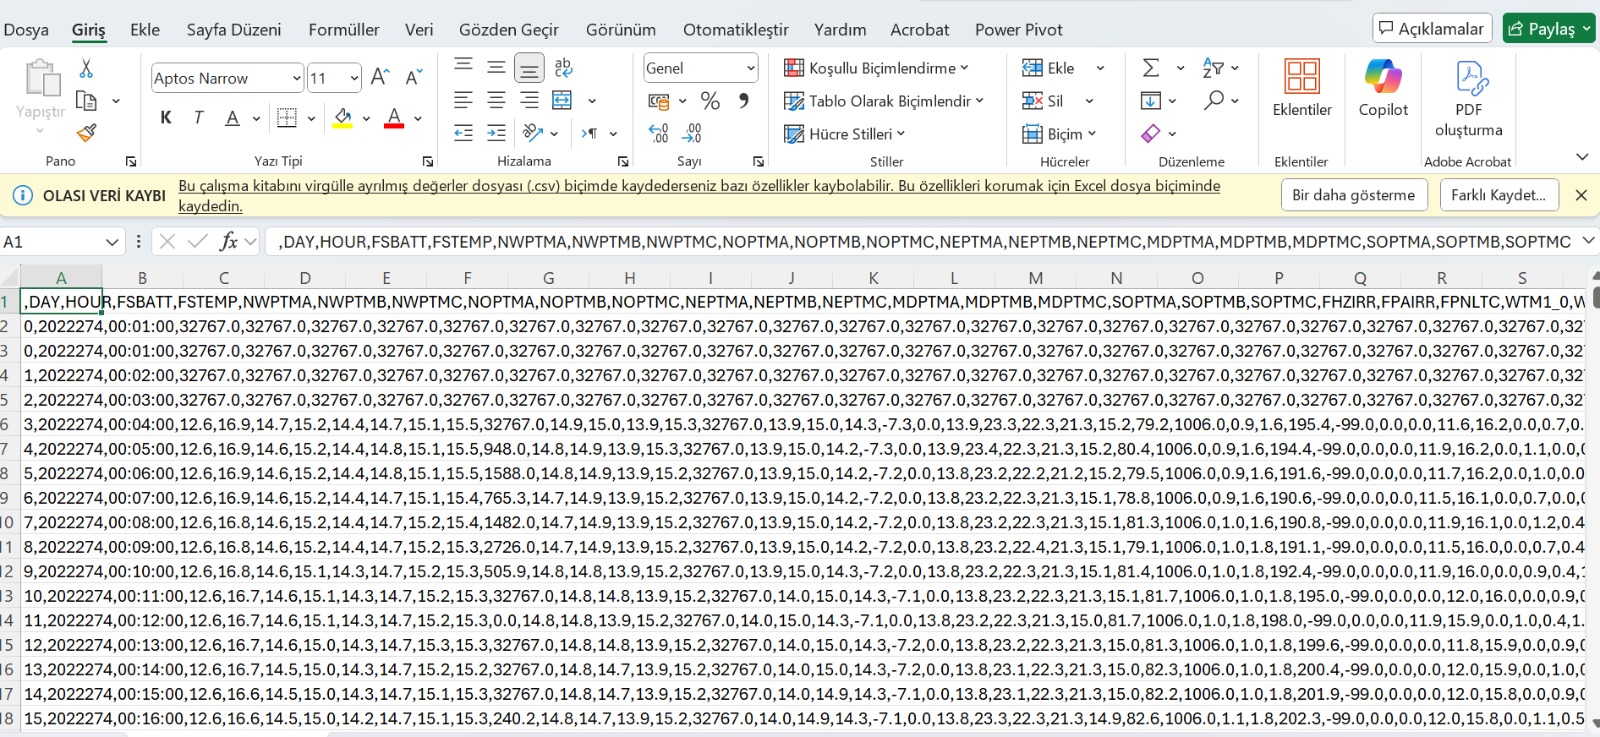
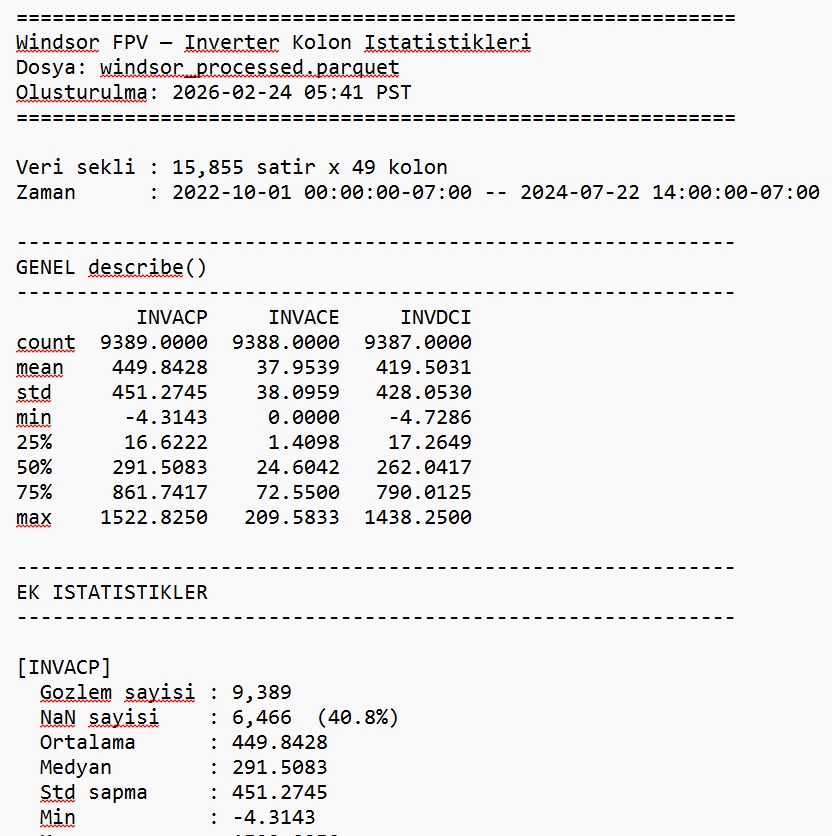
Gözde analyses the performance of solar power plants. The raw SCADA data she works with ran to 15,855 rows and 49 columns; she was doing the analysis in licensed, expensive software, and every new question left her dependent on somebody else.
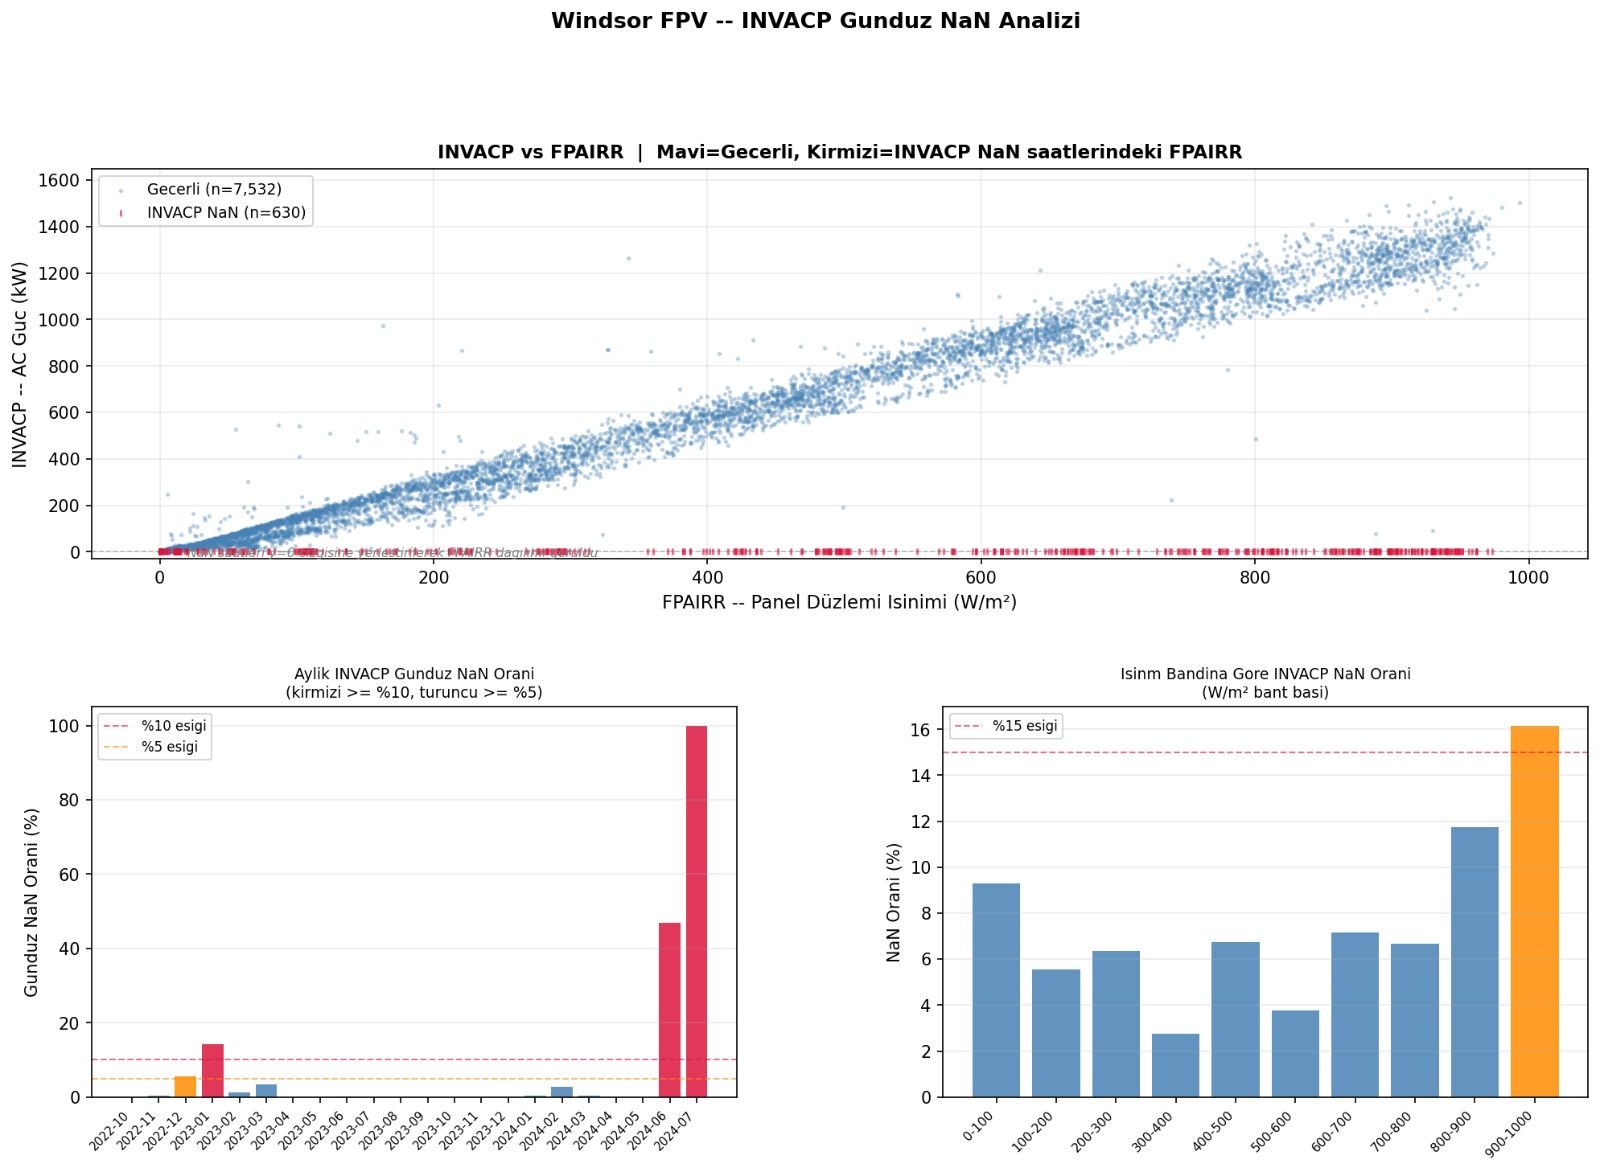
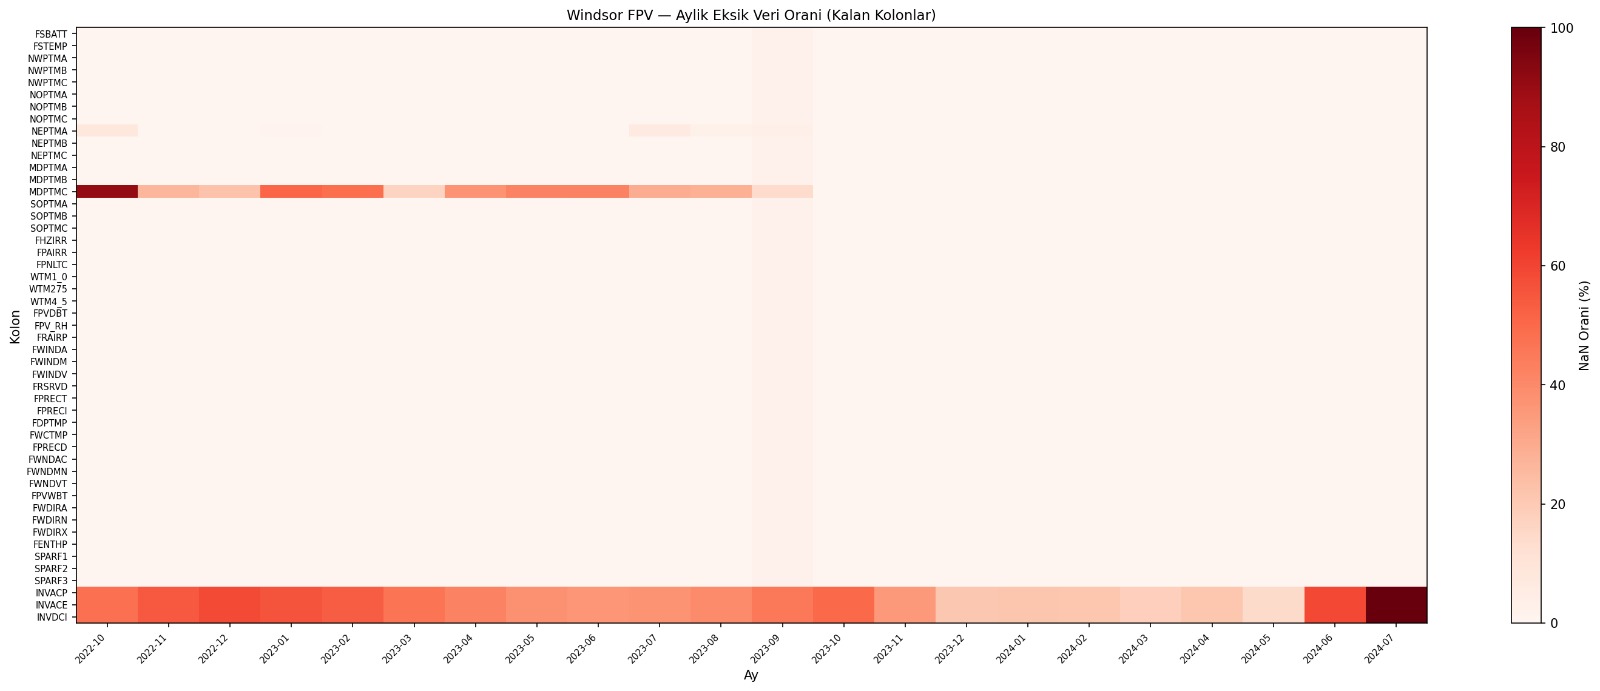
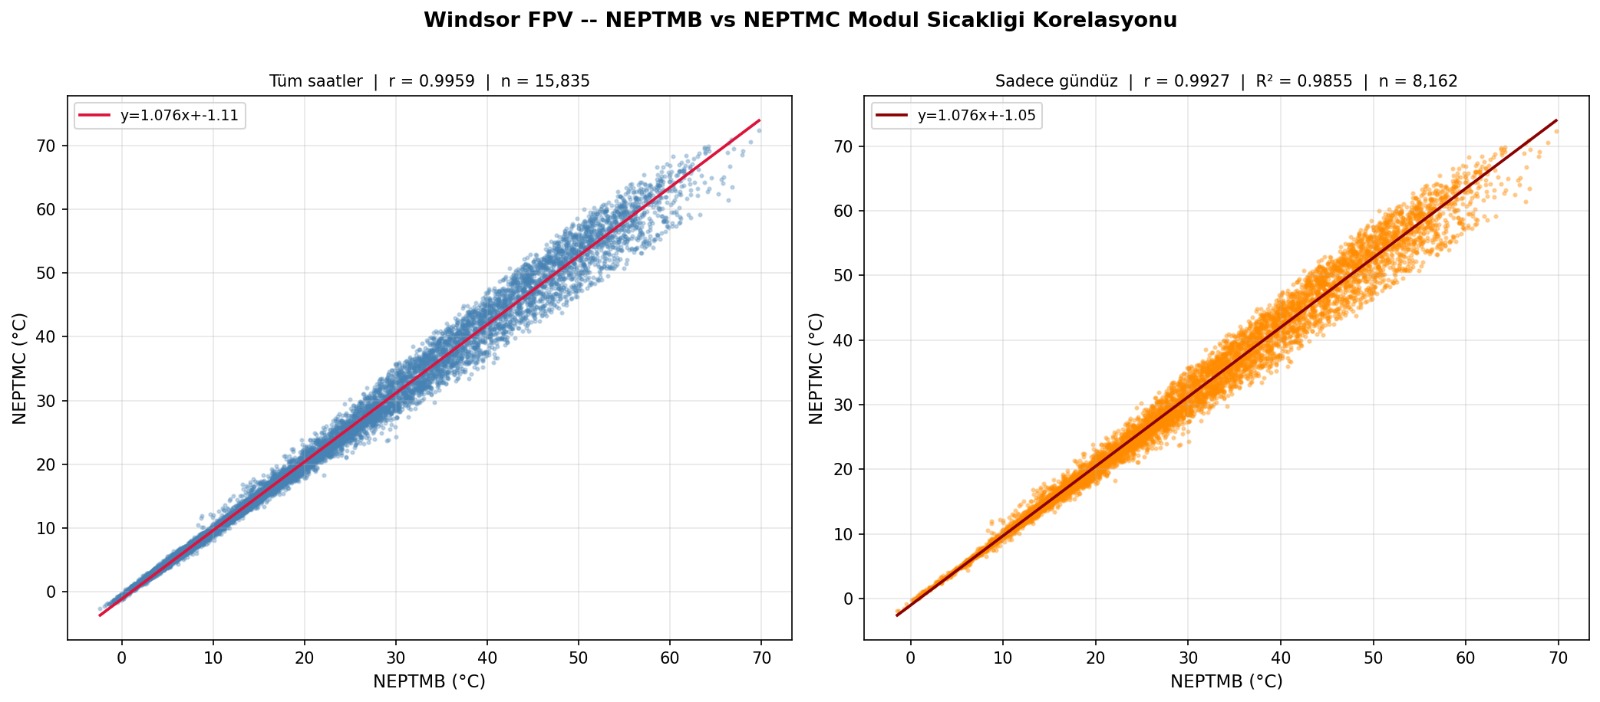
In the workshop she built her own analysis pipeline in Python with Claude Code. It produces charts comparing inverter performance against irradiance, threshold-based detection of missing values, a heatmap of how much data is missing month by month, and a cross-check between sensors (module temperature correlation, r = 0.99).
Now when a new question arrives she runs the analysis herself, in minutes.